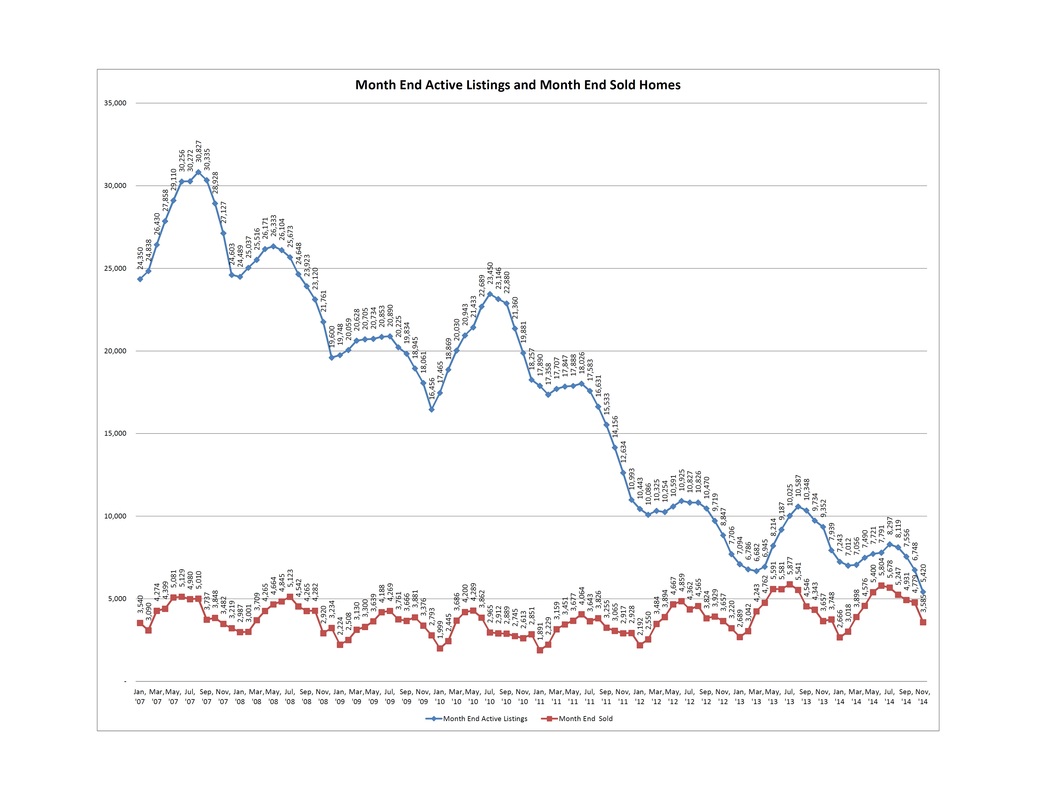
These are very special times in the metro Denver real estate market. Home prices are up, rents are up, inventories of homes both for sale and rent are low and our future outlook continues to look great. We talk about some aspect of real estate every month in this newsletter, but sometimes I think it can be hard to realize just how terrific our real estate market is without taking a step back and looking at the big picture. A great way to do this is to check out the recent press headlines and review the real estate news about our local market. In a word, it is amazing!
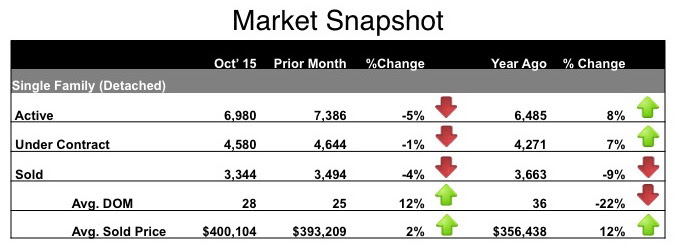
DENVER COUNTY HOME SELLERS MAKE OUT BIG IN Q3
Denver Post | 11/5/15
"Home sellers in Denver County made out big in the third quarter, where sellers sold for an average of a 41.5 percent gain over what they originally paid. That's according to research conducted by California housing data company RealtyTrac, which placed Denver County at No. 6 in the country for highest percentage sales gains. In September, RealtyTrac said Denver home sales were on pace to set a 10-year record, and median selling prices in Denver set an all-time high this summer."
CONDOS APPRECIATING MORE THAN SINGLE-FAMILY HOMES IN DENVER
Denver Business Journal | 10/27/15
"Condos in Denver have appreciated nearly 20 percent over the past year, which is nearly four times the national average and well above the single-family home appreciation rate in Denver. According to Seattle online real estate company Zillow, single-family homes in Denver have appreciated 15.9 percent over the past year, while condos have appreciated 19.7 percent. The yearly 15.9 percent increase in Denver single-family home appreciation was the biggest jump in the country while the 19.7 percent annual increase in condo appreciation was the second-biggest jump in the country, trailing only the Dallas-Fort Worth area, which recorded a 20.1 percent annual increase in condo appreciation."
HOW DOES DENVER RATE AMONG NATION'S BEST PLACES TO OWN A HOME?
Denver Business Journal | 11/9/15
"Where's the best place in the country to own a home? Right here in Denver, according to a new report. Porch and Redfin created the new list, based on a survey of about 10,000 U.S. homeowners in 67 markets, and using criteria including: healthy living, commute, climate, educational opportunity, economic opportunity, resident satisfaction, walkability, security and safety, real estate confidence, and tax fairness. Denver did the best, ranking No. 1 in the country, in the categories of health living and climate, and coming in No. 2 in resident satisfaction."
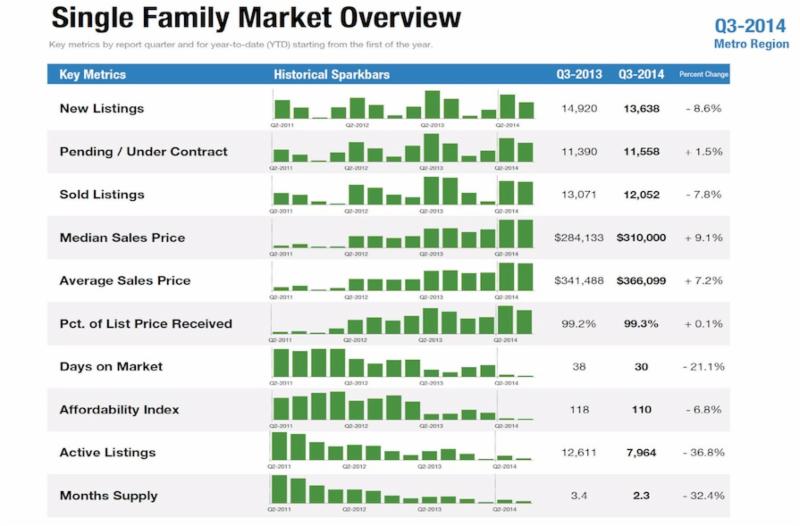
DENVER REAL ESTATE MARKET GROWTH IS FOURTH HIGHEST IN U.S, SAYS NEW REPORT
Denver Business Journal | 10/26/15
"The Denver area residential real estate market experienced the fourth-highest increase in a new housing report. The Freddie Mac Multi-Indicator Market Index (MiMI) uses four indicators to track an area's residential real estate growth, including home purchase applications, payment-to-income ratios (changes in home purchasing power based on house prices, mortgage rates and household income), proportion of on-time mortgage payments in each market, and the local employment picture."
There wasn't room in this post to include all the recent articles, and the good news just keeps coming! For additional articles highlighting Denver real estate news, please contact me.
If you're interested in learning about the real estate market and how you might take better advantage of it, whether you're looking to buy, sell, or invest, feel free to give me a call. I'd love to sit down with you, answer all your questions, and show you what's happening in our incredible real estate market!
And as always, thank you for reading each month! I truly appreciate you!
DENVER COUNTY HOME SELLERS MAKE OUT BIG IN Q3
Denver Post | 11/5/15
"Home sellers in Denver County made out big in the third quarter, where sellers sold for an average of a 41.5 percent gain over what they originally paid. That's according to research conducted by California housing data company RealtyTrac, which placed Denver County at No. 6 in the country for highest percentage sales gains. In September, RealtyTrac said Denver home sales were on pace to set a 10-year record, and median selling prices in Denver set an all-time high this summer."
CONDOS APPRECIATING MORE THAN SINGLE-FAMILY HOMES IN DENVER
Denver Business Journal | 10/27/15
"Condos in Denver have appreciated nearly 20 percent over the past year, which is nearly four times the national average and well above the single-family home appreciation rate in Denver. According to Seattle online real estate company Zillow, single-family homes in Denver have appreciated 15.9 percent over the past year, while condos have appreciated 19.7 percent. The yearly 15.9 percent increase in Denver single-family home appreciation was the biggest jump in the country while the 19.7 percent annual increase in condo appreciation was the second-biggest jump in the country, trailing only the Dallas-Fort Worth area, which recorded a 20.1 percent annual increase in condo appreciation."
HOW DOES DENVER RATE AMONG NATION'S BEST PLACES TO OWN A HOME?
Denver Business Journal | 11/9/15
"Where's the best place in the country to own a home? Right here in Denver, according to a new report. Porch and Redfin created the new list, based on a survey of about 10,000 U.S. homeowners in 67 markets, and using criteria including: healthy living, commute, climate, educational opportunity, economic opportunity, resident satisfaction, walkability, security and safety, real estate confidence, and tax fairness. Denver did the best, ranking No. 1 in the country, in the categories of health living and climate, and coming in No. 2 in resident satisfaction."
DENVER REAL ESTATE MARKET GROWTH IS FOURTH HIGHEST IN U.S, SAYS NEW REPORT
Denver Business Journal | 10/26/15
"The Denver area residential real estate market experienced the fourth-highest increase in a new housing report. The Freddie Mac Multi-Indicator Market Index (MiMI) uses four indicators to track an area's residential real estate growth, including home purchase applications, payment-to-income ratios (changes in home purchasing power based on house prices, mortgage rates and household income), proportion of on-time mortgage payments in each market, and the local employment picture."
There wasn't room in this post to include all the recent articles, and the good news just keeps coming! For additional articles highlighting Denver real estate news, please contact me.
If you're interested in learning about the real estate market and how you might take better advantage of it, whether you're looking to buy, sell, or invest, feel free to give me a call. I'd love to sit down with you, answer all your questions, and show you what's happening in our incredible real estate market!
And as always, thank you for reading each month! I truly appreciate you!