
Ever wonder how the current market inventory compares to times past?
The following picture provides great historical context of Available Home Inventory vs. Number of Sold Homes across the Denver metro area over the last 8 years.
The following picture provides great historical context of Available Home Inventory vs. Number of Sold Homes across the Denver metro area over the last 8 years.
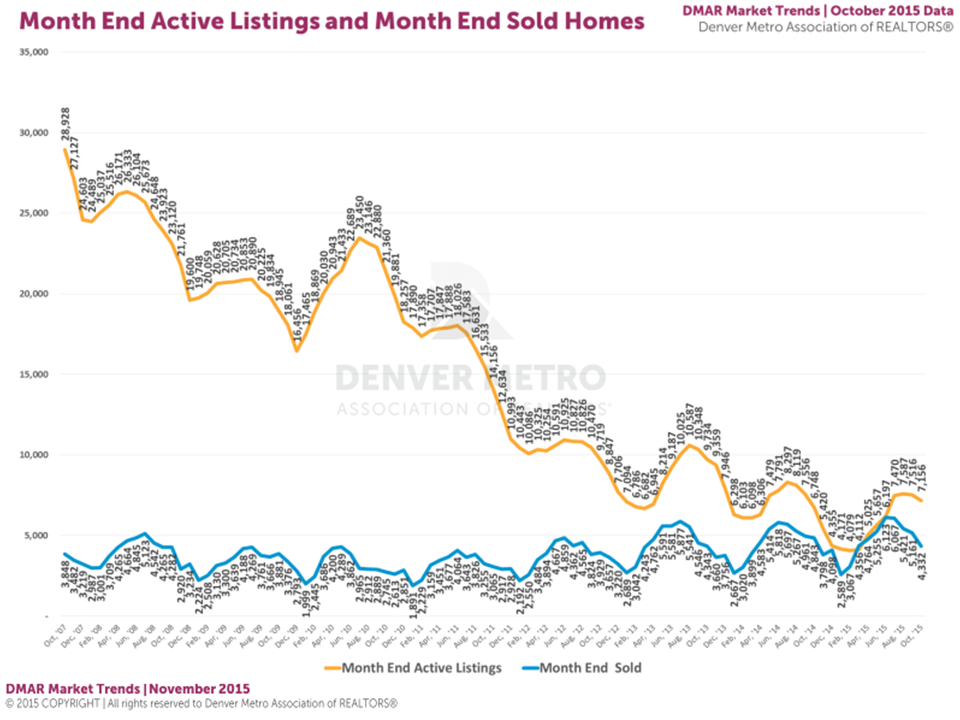
The yellow line represents the number of homes for sale at the end of that particular time period. The blue line represents the actual number of homes sold during that same period.
Some Key Observations:
1. The far left side of the chart highlights the tremendous amount of inventory on the market (almost 29,000 homes!), largely due to the high number of bank foreclosures. With such high inventory, prices were depressed (law of supply of demand).
2. The number of homes sold each year was surprisingly steady during the economic downturn. It was lower on average than in recent years, but not to the extent that one might have assumed. In fact, on average there are around 13 home closings per 1000 people. In recessions, it's around 11. In the boom times, it's around 15. That's not a big variation!
3. According to the chart, home sales have been generally trending upward since 2012. This can be largely attributed to an improving economy (one of the best in the country) and to the huge influx of people to the area.
4. We didn't arrive at this low inventory situation overnight. It took almost a decade to burn off all of the excess bank inventory.
5. What does this mean for a buyer or seller? As long as inventory is tight overall, buyers will have to be prepared to compete to win a home. Sellers will generally still have the upper hand.
Thanks again for reading! And as always, feel free to contact me with any of your questions or thoughts.
-Drew Morris
"History of Denver Home Inventory in One Picture" by @Realtor_Drew on @LinkedIn https://t.co/Ih3yAzzEQD #Denver #DenverRealEstate
— Andrew (Drew) Morris (@Realtor_Drew) December 3, 2015