There is a lot of talk about the booming real estate market in the Denver area. We read almost weekly about how much prices have appreciated, how low the available home inventory is, etc, across the Denver area. Often times however, the articles we read in the local publications do provide a great overall picture, but fall short of providing specifics that buyers and sellers can find helpful. Often times, micro-markets in the various neighborhoods across the entire Denver metro area differ from that of the overall whole.
This is where the Price Change Map can step in and fill in the gaps. Whenever I am working with a buyer or seller, I like to dive into this to paint a more specific picture of what their neighborhood market looks like. From this, we can determine how it applies to them and what we need to do to best be prepared for buying and/or selling.
Take a look at our most recent Price Change Map for Central Denver:
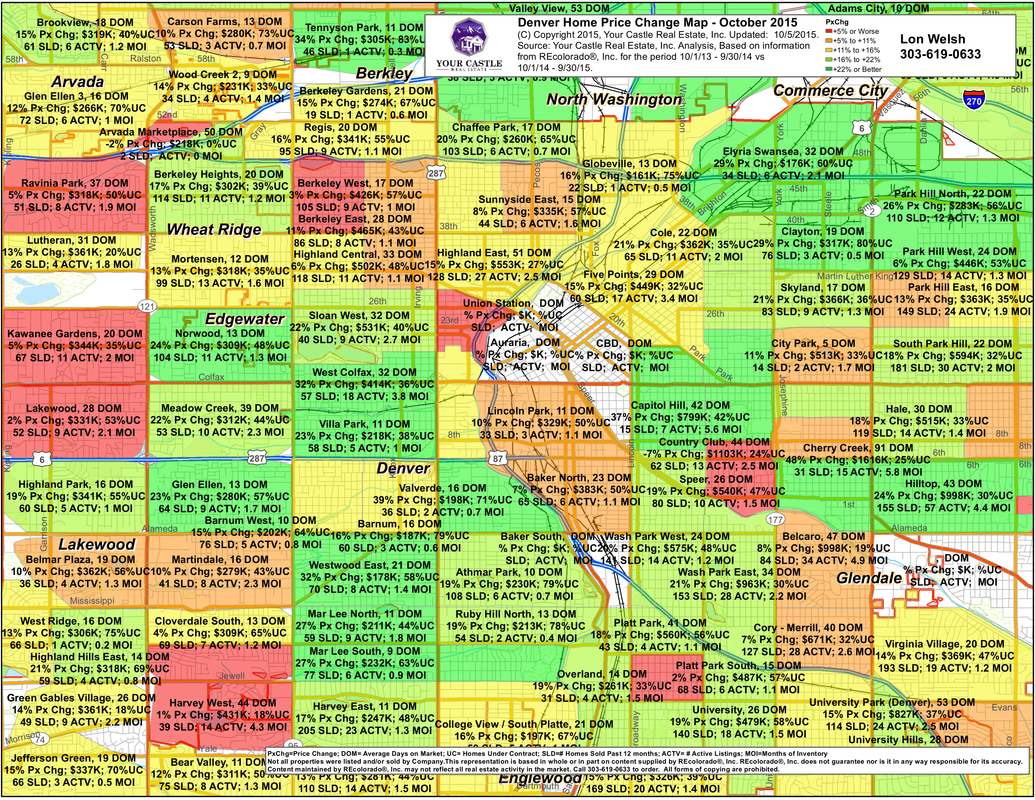
There are a few key elements that this map provides by neighborhood/area:
1. Average Days on Market of sold homes.
2. Average price appreciation over the last 12 months.
3. Average sold price.
4. Percentage of homes Under Contract as of the end of the quarter.
5. Number of homes sold over the last 12 months.
6. Number of homes currently active as of the end of the quarter.
7. Available Months of Inventory (MOI) based on the current absorption rate.
Each of these elements provides specific data that can be used in positioning for buying and selling. For example, I've noticed that in some local markets, the available MOI is actually higher, allowing for more buyer opportunities. What a great thing! :)
Enjoy the map, learn about your area of interest, and let me know if you'd like me to dive into anything discussed here a little more.
Thanks for reading!
Fill in the gaps. The Central Denver Price Change Map. https://t.co/3skpOYzkQG
— Andrew (Drew) Morris (@Realtor_Drew) November 17, 2015